Interaction to Next Paint (INP) is a Core Web Vitals metric that tracks website responsiveness. More specifically, it measures the longest latency between a user interaction and a visual response as painted by the browser.
Responsiveness ensures a consistently smooth, frustration-free, and engaging experience for users. And, as a Core Web Vital metric, optimizing INP can lead to increased search engine rankings.
INP replaced First Input Delay (FID) as one of the three Core Web Vitals metrics for measuring overall user experience. While FID only tracks a page's responsiveness to the first user interaction, INP tracks all interactions until browsers paint the next frame.
Understanding How INP is Measured
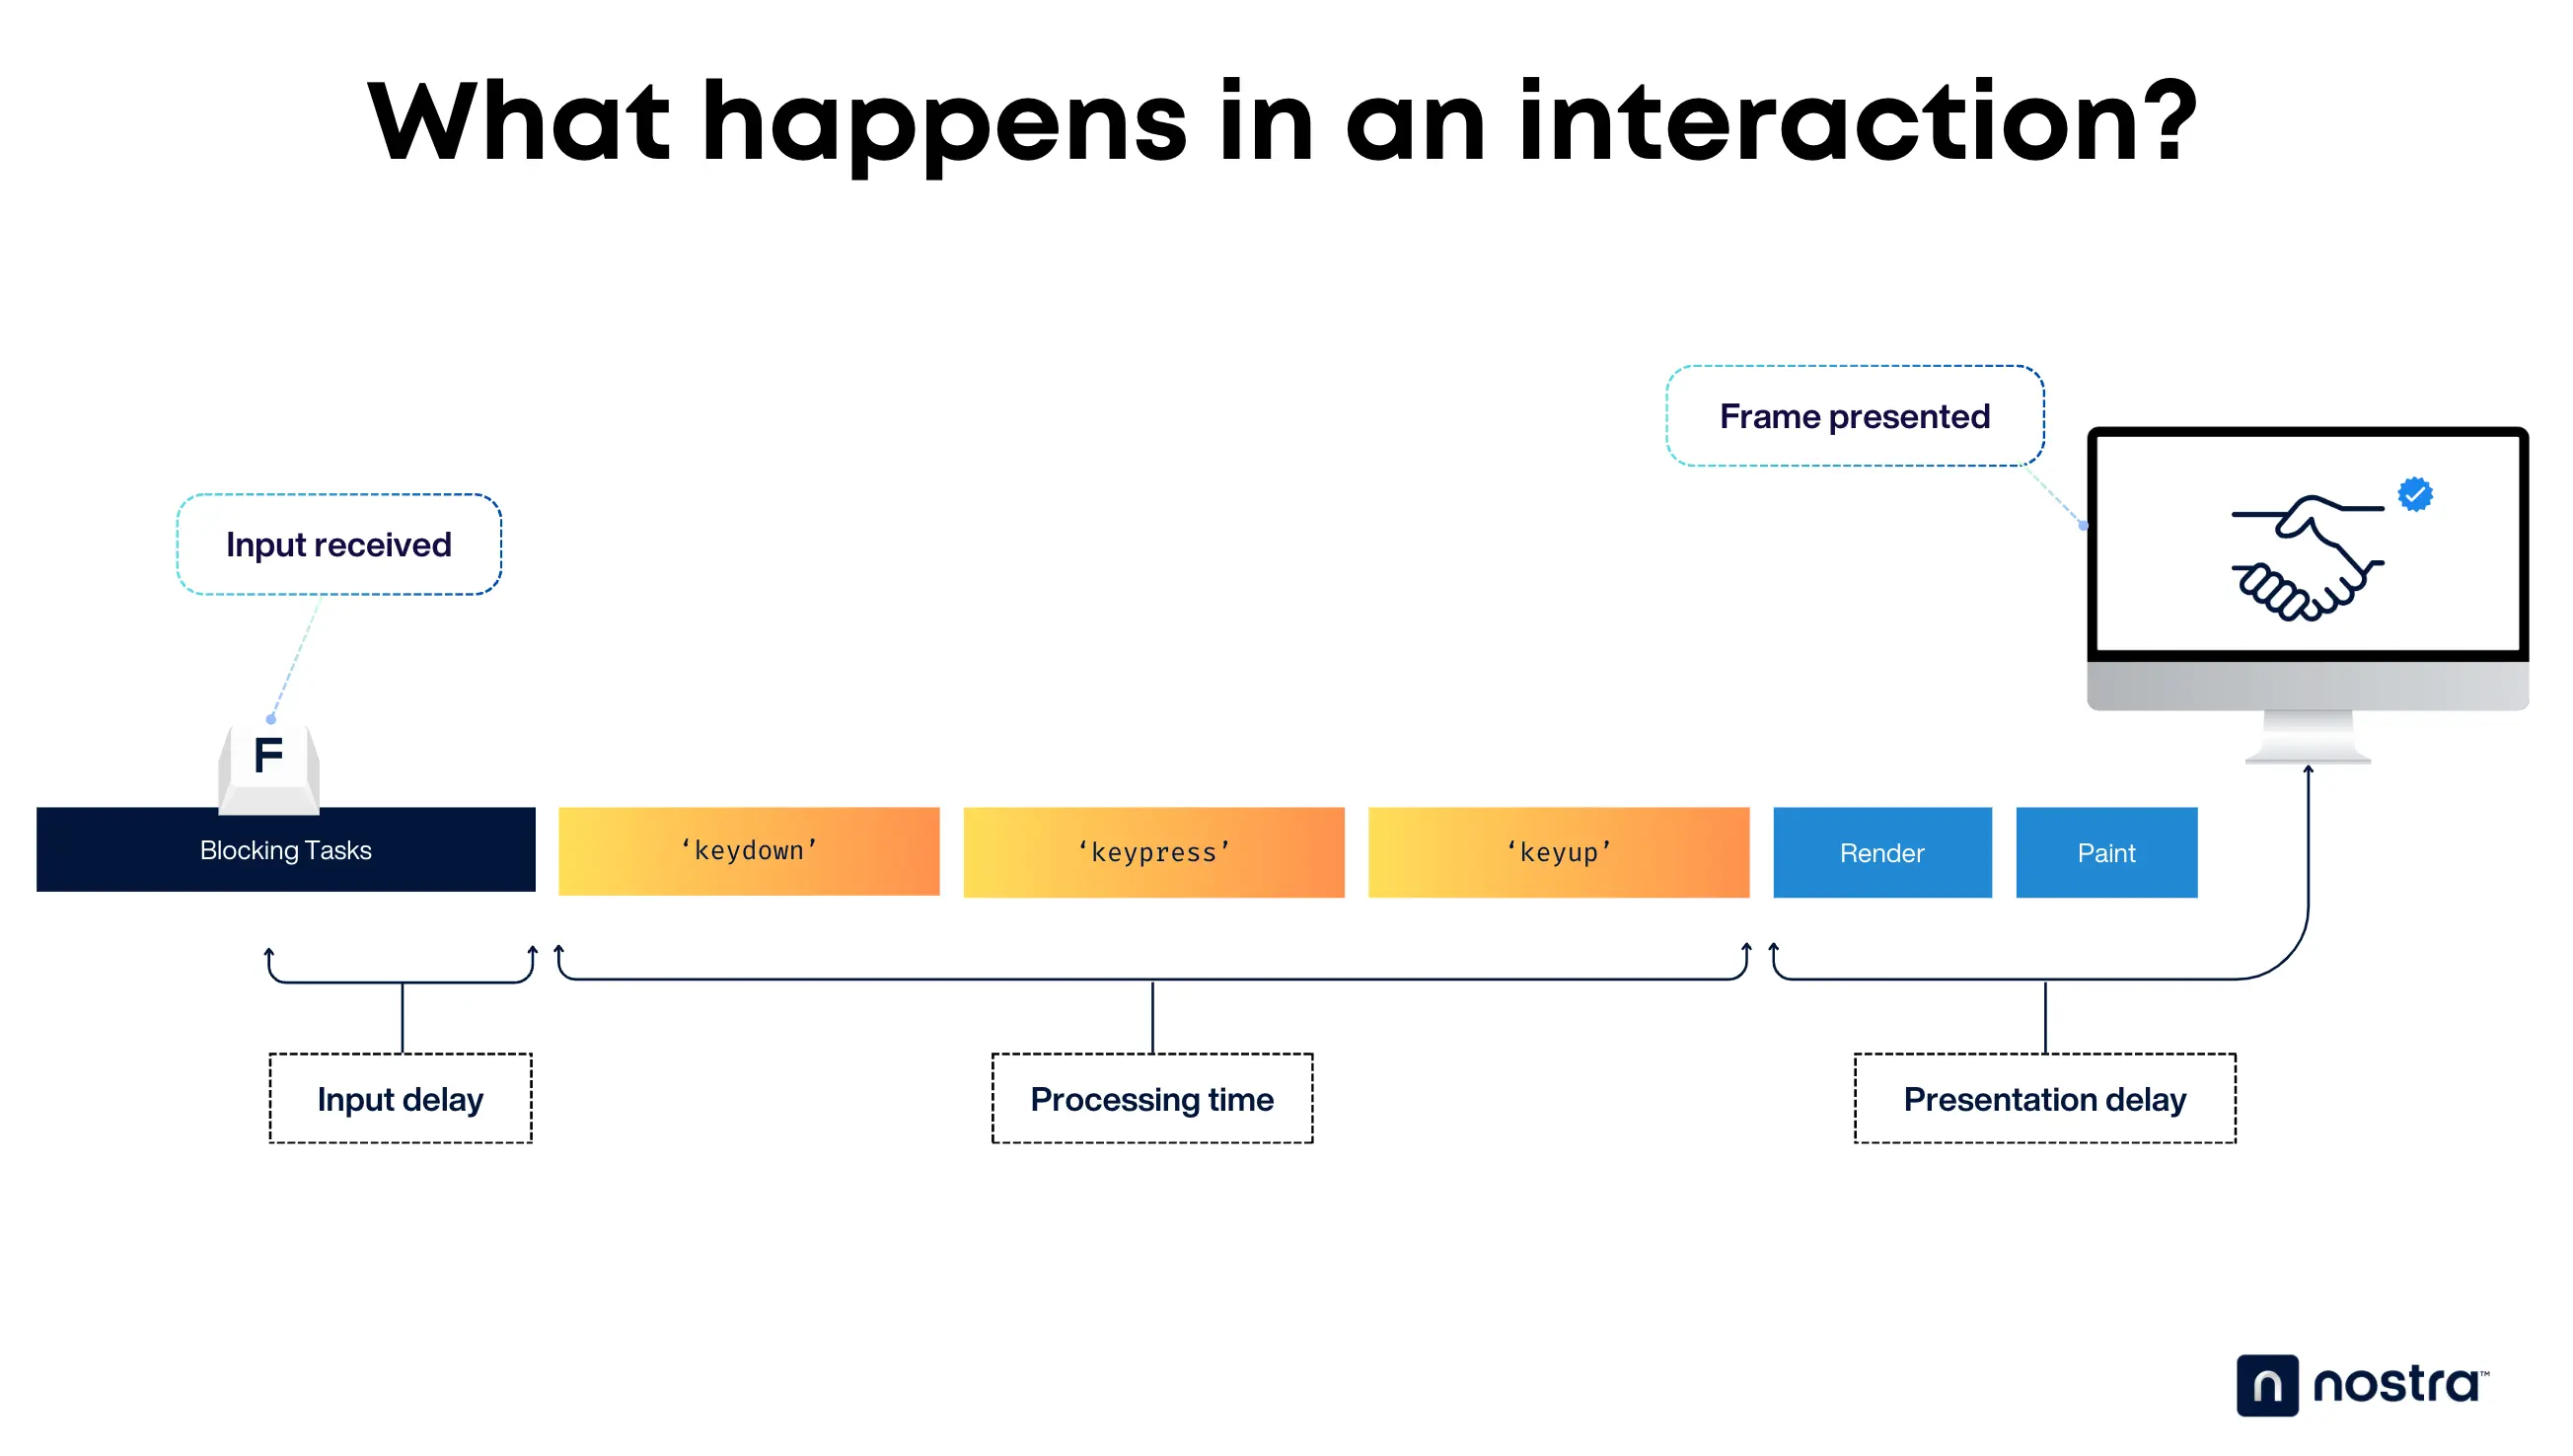
To understand how INP is tracked, it's important to discuss the events that occur within an interaction.
Interaction to Next Paint Timeline
The interaction timeline can be broken down into three stages:
- Input Delay — The time it takes for event handlers to fire up right after user input.
- Processing Time — The time required for event handler callbacks to run.
- Presentation Delay — The time before the response is rendered and painted by the browser.

Types of Interactions Considered for INP
Keep in mind that only the following interaction types are considered when tracking INP:
- Mouse clicks
- Taps on a touchscreen device
- Keyboard presses
Other interactions, like scrolling with the mouse wheel or zooming into the page aren't considered when measuring INP. The only exception is if these interactions also record or trigger clicks, taps, and keypresses.
Calculating INP
As previously mentioned, INP tracks all interactions that occur on a page. However, only the interaction with the longest delay is reported when determining the page's INP score.
To prevent outliers, INP doesn't count the longest delay out of 50 interactions. Furthermore, only the 75th percentile of tracked sessions will be reported.
Lastly, INP is tracked in milliseconds. The lower the INP, the more responsive a website or page performs overall.
- 200 milliseconds or lower (good responsiveness)
- 201 to 500 milliseconds (needs improvement)
- Over 500 milliseconds (bad responsiveness)
Tools for Measuring INP
INP can be measured using the same tools that track other Core Web Vitals metrics.
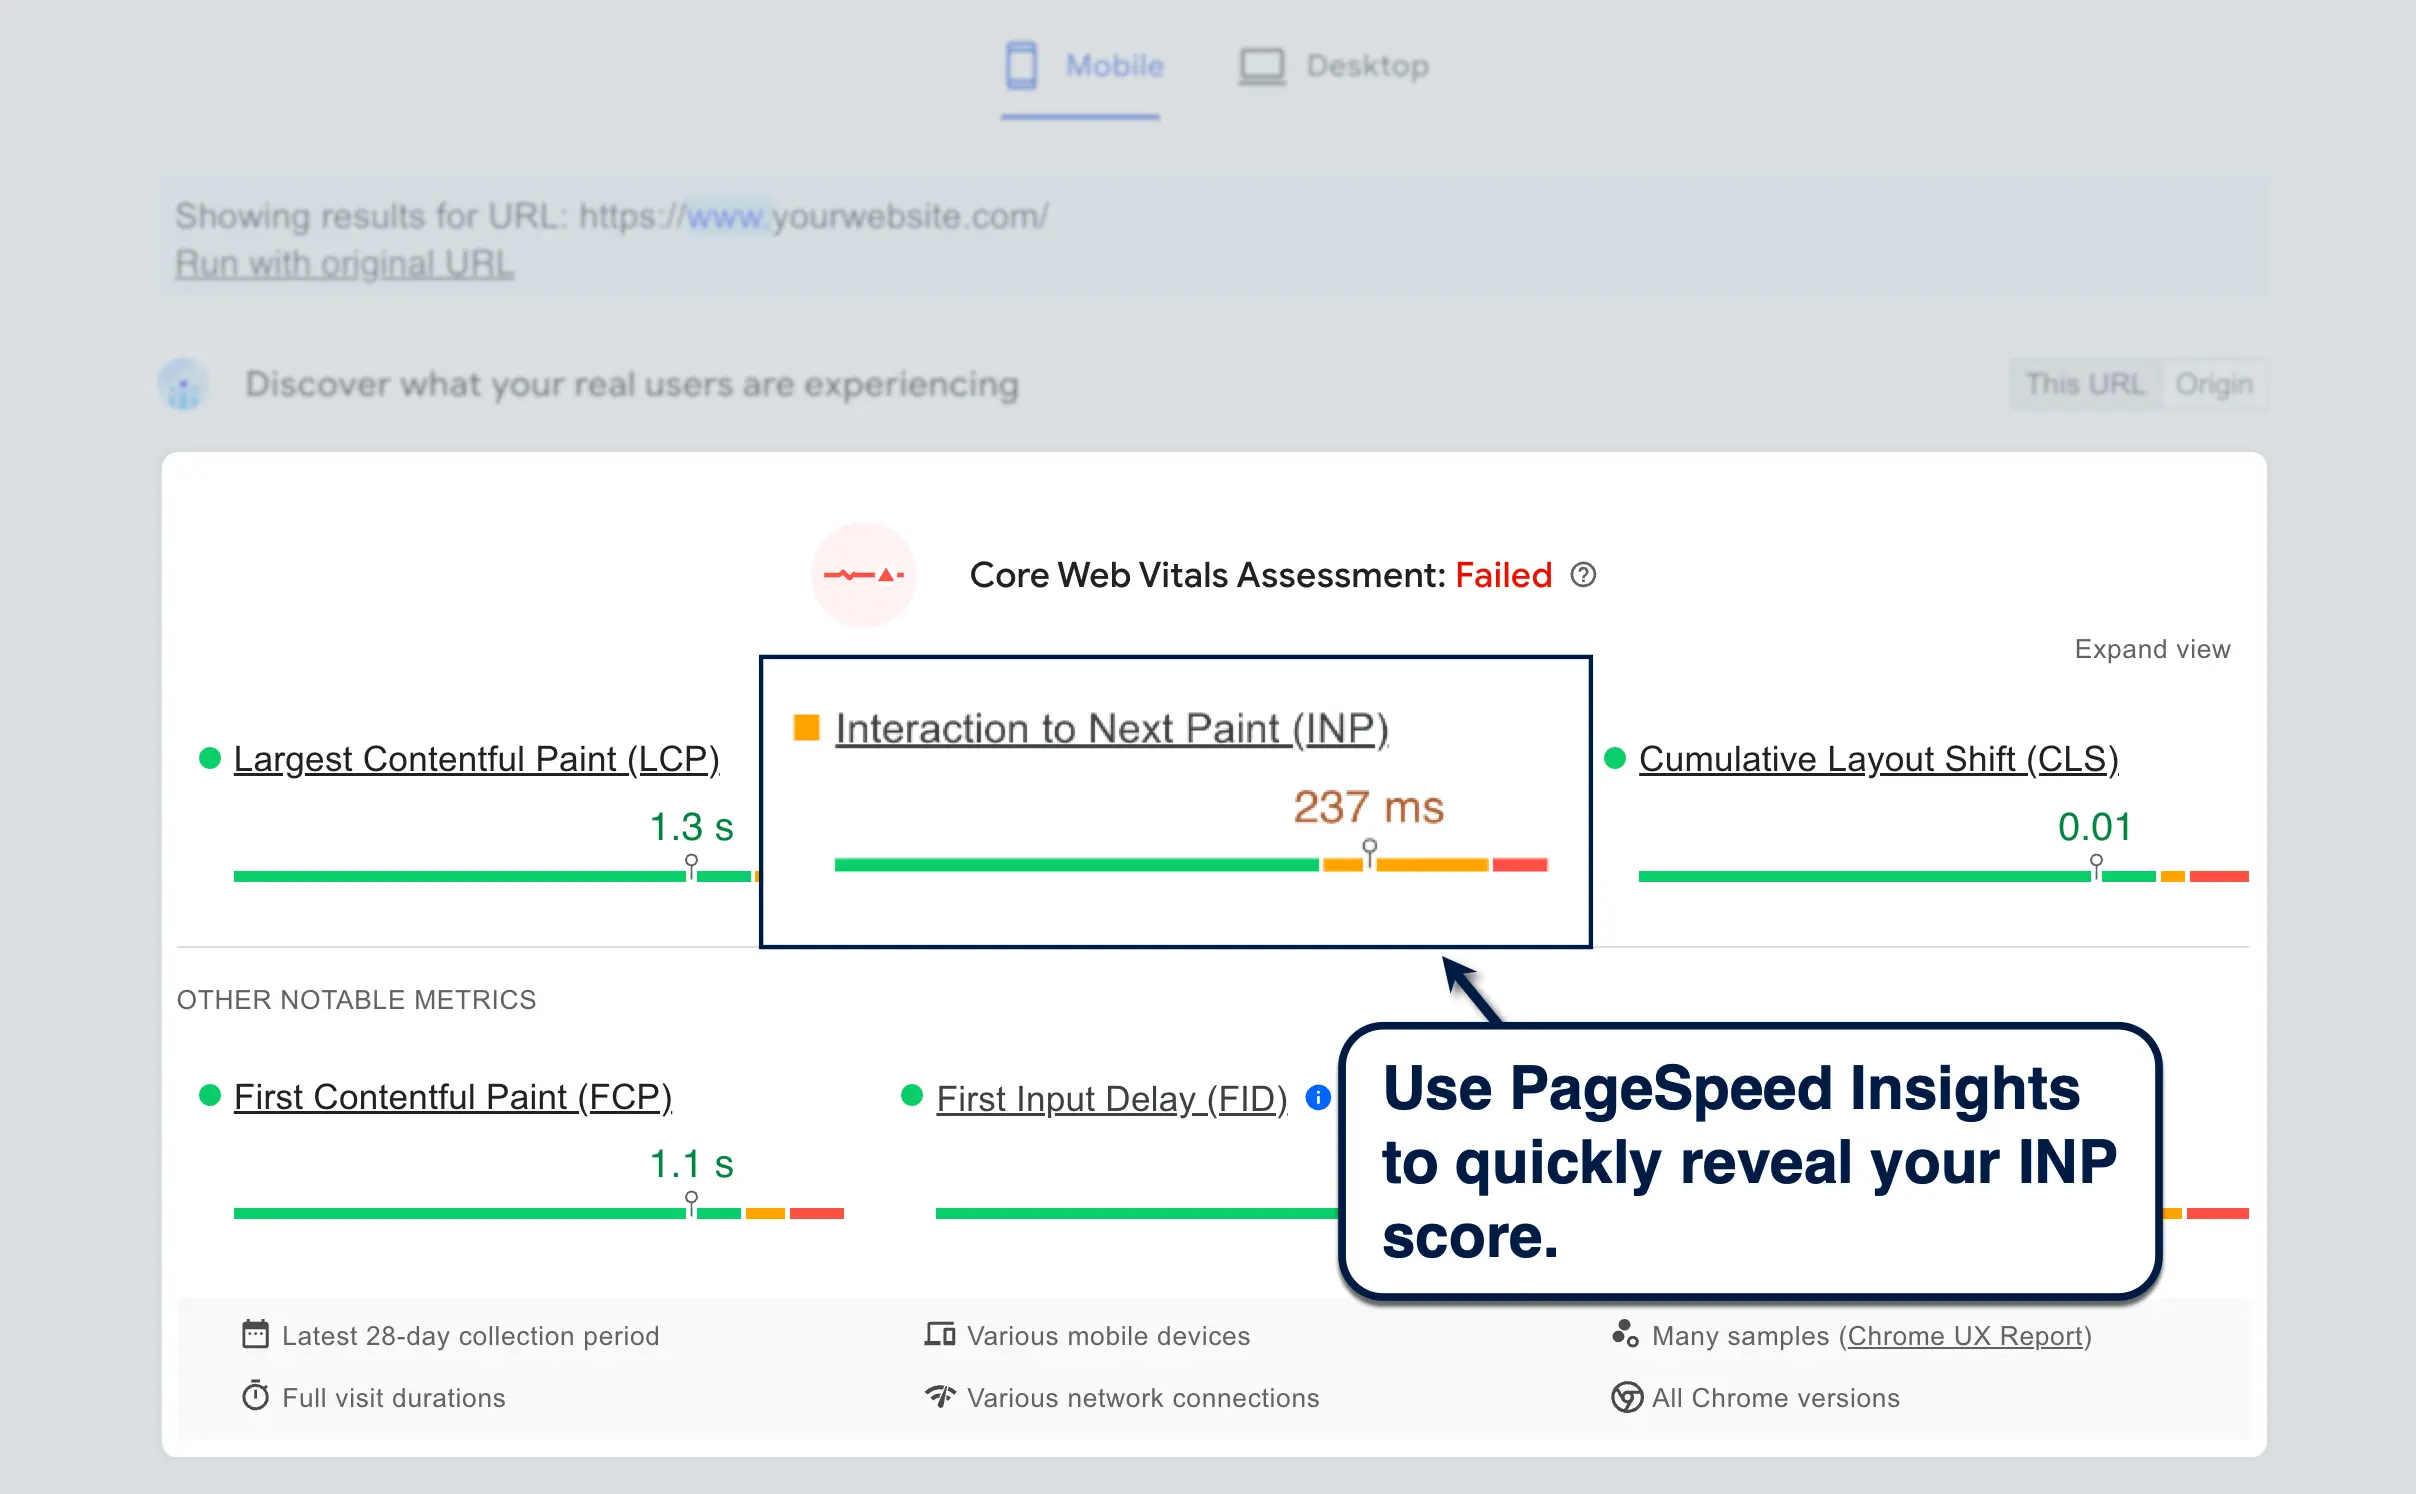
PageSpeed Insights, for instance, is a great option if you need a quick diagnosis of your INP. Just enter your page URL, click 'Analyze,' and wait for your page's performance report on mobile and desktop.

Just remember that INP tracking is only available if your website is included in the official Chrome User Experience Report (CrUX) dataset.
Here are other tools you can use to measure INP:
- CrUX Dashboard — Generate an in-depth report of your Core Web Vitals via Looker Studio.
- Lighthouse — Run an analysis of your web page directly through Chrome DevTools, which can be launched via Chrome's settings menu or inspection mode.
- Google Search Console — Analyze your Core Web Vitals along with other on-page SEO factors.
Factors Affecting INP
There are a couple of things that can affect your website's INP score:
JavaScript Execution Time
JavaScript plays a critical role in the responsiveness of most websites. After all, it can be present in every stage of a user interaction — more commonly in the processing and presentation phases.
Render-blocking JavaScript code can increase input delay, whereas poorly-optimized code can bog down task execution and callbacks, which prolongs the processing time. Of course, unoptimized JavaScript code can also delay the rendering of your page's visual response.
Main Thread Workload
JavaScript isn't the only thing that can block the main thread — AKA the sequence of execution for JavaScript assets, rendering tasks, and user interactions.
Picture the main thread as your website's front-of-house manager. If it's preoccupied with time-consuming tasks in the background, like parsing CSS files or validating a form, it'll take longer to run user-facing tasks and render visual responses.
Network Latency and Server Response Time
INP is one of the performance metrics that can be significantly impacted by network latency.
Naturally, users with poor internet connection will experience slower responses from any website. But remember that page load speed isn't just a client-side factor.
Relying on shared hosting, for example, puts your website's responsiveness at the mercy of other sites and web apps hosted on the same server. Decisions like ignoring page bloat, not using a Content Delivery Network (CDN), and disabling caching also contribute to worse network latency.
Device Capabilities
Speaking of client-side factors, the user's device specifications also have a direct impact on your website's responsiveness — at least, in their experience. Factors such as RAM, operating system, and browser of choice can have a profound effect on your website's perceived performance.
That doesn't mean there's nothing you can do to improve the experience of users on low-end devices. After all, you have tools like Lighthouse and WebPageTest that can emulate your website's performance across various devices.
Proven Strategies to Optimize INP
Remember, the idea behind Core Web Vitals isn't just to measure performance. The whole point is to provide you with a frame of reference or benchmark to determine whether or not your optimization strategies are working.
That's why Core Web Vitals tools like PageSpeed Insights include actionable recommendations that will lead your efforts in the right direction.
When it comes to optimizing INP, here are four proven strategies you should try:
1. Optimize JavaScript Code
It's clear that JavaScript can be a huge bottleneck to your website's performance and responsiveness.
Luckily, there are several ways to optimize your JavaScript code and keep the user experience on your website as smooth as possible.
The first and perhaps easiest step is to implement code minification. This is the process of removing all white space and unnecessary characters in your website's code-based assets.
Use a tool like Minifier.org if you want to manually optimize your code one by one. Just launch the tool, enter your code's URL (or paste the entire code itself), and click 'Minify.'

Another approach is to use code-splitting, which is the practice of chopping up large code into smaller, more manageable pieces.
Let's say your JavaScript is supposed to run multiple functions — all of which need to run as a single task before running event handlers for interactions.

What you need to do is to isolate non-critical functions and run as separate tasks rather than as part of the main task.
The most straightforward way to do this is through the 'setTimeout()' global function. Just leave the important, user-facing functions in the main task while grouping the rest in a separate task.

TL;DR: Code-splitting allows you to run event handlers for user interactions sooner than waiting for a single, long block of JavaScript to finish loading.
Another strategy is to asynchronously load JavaScript based on priority. This is usually done through the 'postTask()' method, which uses the following syntax:

The 'postTask()' function asynchronously runs tasks based on their order and priority. High-priority tasks should be tagged as "user-blocking," while the rest can be tagged as "background."
2. Reduce Main Thread Workload
As far as optimizing the main thread, writing more efficient JavaScript code is a step in the right direction.
You can further lighten the main thread workload using web workers. These essentially pluck tasks off the main thread and run them in a separate thread, giving the main thread more wiggle room for more important tasks.
This, of course, allows your page to respond to user interactions faster.
To take advantage of web workers, use the 'Worker()' constructor call with the specific JavaScript file you want to run outside the main thread.

Be careful not to use workers on scripts that require access to the DOM and certain APIs. Only APIs useful for background tasks, like timers, WebSockets, and WebAssembly are runnable on web workers.
To enhance responsiveness further, you may also want to use more efficient DOM manipulation to avoid layouts or "reflows" and minimize presentation delay.
In web development terms, layout refers to the process wherein the browser calculates the geometric properties of page elements, particularly their dimensions and position. Avoiding functions and events that change an element's width, height, and other geometric properties prevents layout — thus, boosting your page's responsiveness.
Consider using FastDOM to batch all your DOM manipulation tasks and prevent unnecessary layout.
3. Optimize Network Requests
While you can't completely prevent delayed responses due to network latency, you can employ strategies to streamline network requests and improve your INP score.
One example is to preload critical resources using the 'rel="preload"' attribute for critical resources. Its purpose is simple: to retrieve assets like web fonts and scripts as soon as the page starts loading.
Here's how you can use the preload attribute for different asset types:

If you're working on code-based assets and pulling scripts from third-party sources, make sure they're not causing significant INP using your Core Web Vitals tracking tool.
Third-party scripts come from external resources, like plugins, themes, page builders, and other tools. To minimize their impact on INP, you can pay for CDN services, implement asynchronous loading, upgrade your hosting service, or get rid of unnecessary third-party add-ons and delete the leftover JavaScript.
4. Consider Server-Side Rendering
In server-side rendering, all the heavy lifting involved in rendering your website is handled by your server. When done, your browser gets a full, ready-to-use HTML of your website that loads and responds fast.
Server-side rendering can lead to substantial gains in performance, especially if your website uses complex interactions or large dynamic content.
Think of it this way: rather than being delivered parts of a whole website and waiting for it to get assembled, you're delivered a completed website that's ready to be interacted with.
Tip: Review this checklist for the complete steps on how to optimize your Core Web Vitals!
Additional Tips and Considerations
Before we wrap up this article, here are a few other things you need to remember about INP:
Input Delay vs. INP
Some users may attribute the overall poor responsiveness of a website to just "input delay." But, from a technical standpoint, input delay is a small component of INP that starts with user input and ends when event handlers start running.
Monitoring and Analyzing INP
Just like a lot of things in website development, trying to improve INP can unearth more performance issues. That's why tracking and analyzing your progress with tools like PageSpeed Insights and CrUX is important. Aim to achieve consistent progress over time rather than attempting to fix everything in one move.
Beyond INP
When optimizing Core Web Vitals, it pays to learn other useful metrics like Time To First Byte (TTFB),Total Blocking Time (TBT), and Largest Contentful Paint (LCP). TTFB measures how long it takes for browsers to receive the first byte of content after an HTTP request, whileTBT measures the time before a busy main thread is ready to handle user action and LCP tracks how long it takes to load the biggest chunk of content on a page.
Conclusion
INP, along with the other Core Web Vitals metrics, paint the complete picture of website performance. Improving it creates a snappier and more responsive experience for users, which is important for sustaining engagement and encouraging conversions.
Remember that it's all about optimizing your website assets, using more efficient layouts, and consistently analyzing your INP score to attain steady progress.
However, not all website owners have the time, effort, and technical know-how to get it done. If you want real and guaranteed results, consider using a performance optimization platform like Nostra to achieve lightning-fast performance without days of nose-deep research and hair-pulling experiments. Book a demo with us today!
.svg)

.svg)
.svg)
.svg)

.svg)


